How to Make a Bell Curve in Excel: Step-by-Step Statistical Visualization
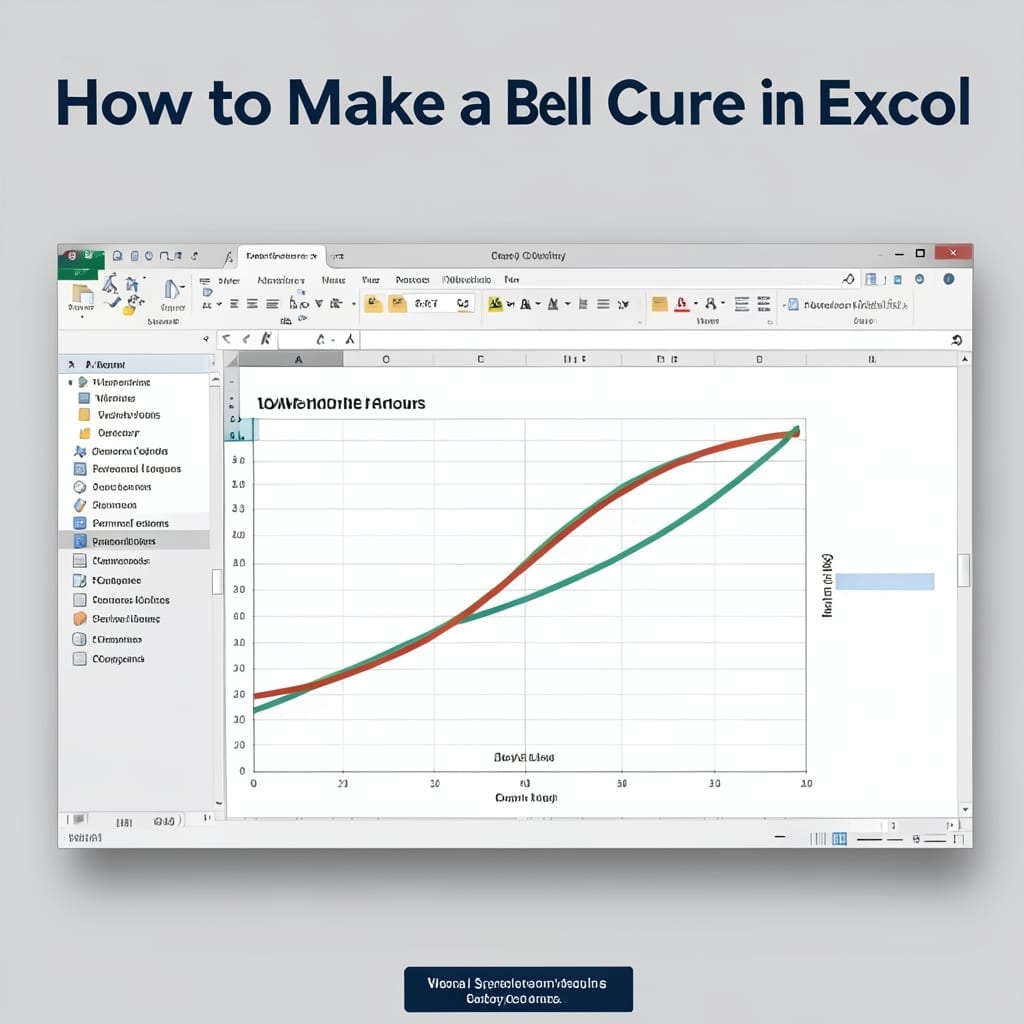
I still remember my stats professor drawing bell curves on the chalkboard at Carnegie Mellon. 💡 Today, Excel can plot that same distribution in under 2 minutes with your dataset. You’ll need a column of raw data and one simple formula to generate the normal distribution curve. No advanced math required—just point, click, and let … Read more